Financial Information
Trends in Key Financial Data
| Term Fiscal Year |
50th Term FY ended March 2023 |
51th Term FY ended March 2024 |
52th Term FY ended March 2025 |
|---|---|---|---|
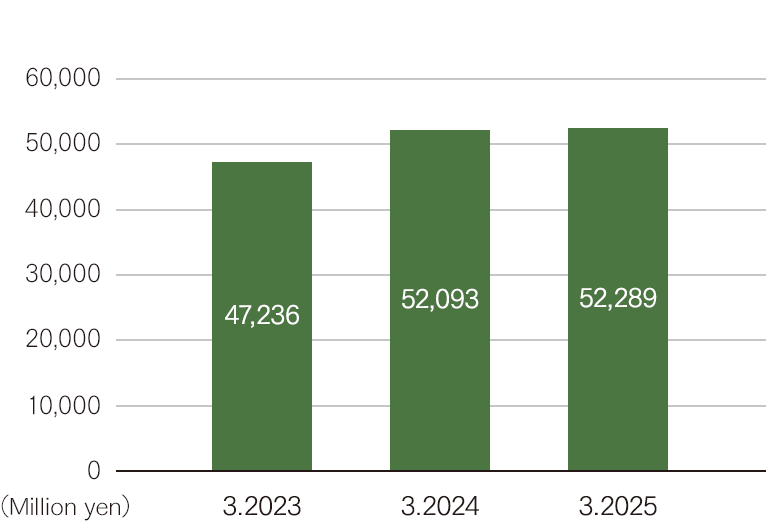
| Sales(Million yen) | 47,236 | 52,093 | 52,289 |
| Operating income(Million yen) | 2,484 | 3,764 | 4,044 |
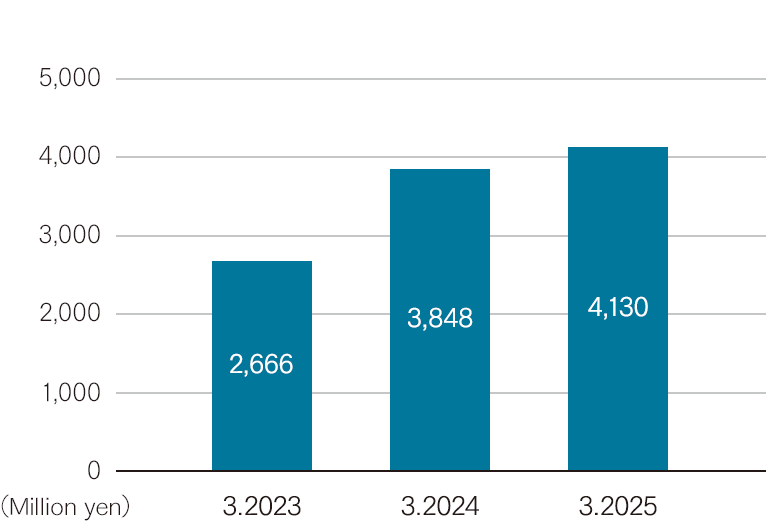
| Ordinary income(Million yen) | 2,666 | 3,848 | 4,130 |
| Profit attributable to owners of parent(Million yen) | 1,291 | 2,487 | 2,545 |
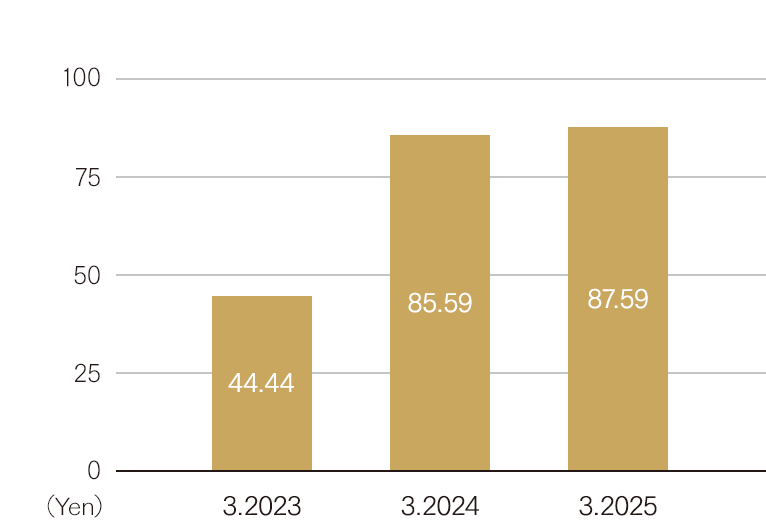
| Net income per share(Yen) | 44.44 | 85.59 | 87.59 |
| Return on equity(%) | 5.1 | 9.3 | 8.9 |
| Return on assets(%) | 6.9 | 9.8 | 10.4 |
| Operating margin(%) | 5.3 | 7.2 | 7.7 |
| Total assets(Million yen) | 39,142 | 39,385 | 40,313 |
| Net assets(Million yen) | 25,918 | 27,826 | 29,541 |
| Equity ratio(%) | 66.2 | 70.7 | 73.3 |
| Net assets per share(Yen) | 892.02 | 957.67 | 1,016.71 |
| Cash flow from operating activities(Million yen) | 3,461 | 4,949 | 3,125 |
| Cash flow from investing activities(Million yen) | △484 | △489 | △437 |
| Cash flow from financial activities(Million yen) | △2,987 | △2,728 | △1,095 |
| Cash and cash equivalents at end of year(Million yen) | 2,406 | 4,139 | 5,733 |
| No. of employees(Persons) | 572 | 572 | 582 |
Sales
Ordinary income
Profit attributable to owners of parent

Net income per share